Industry brief · AI data centers
Bridge power for racks that cannot wait for the grid.
AI halls concentrate the worst of both worlds: training runs that punish every interruption, and grid connections that arrive years late. A 51.2V LFP rack battery backup (BBU) layer puts millisecond-class bridging inside each rack row — sized for GB300-class power swings, with a documented path to ±400V.
Sourced outage data
What downtime actually costs an AI hall.
The case for in-rack bridge power is written in other people's outage reports. Every figure below is sourced — nothing on this page is a projection of ours.
| Signal | Figure | What it means for rack backup | Source |
|---|---|---|---|
| Cost of the last major outage | 57% of operators reported their most recent significant outage cost more than $100k | Downtime math clears the marginal cost of distributed batteries many times over. | Uptime Institute, Annual Outage Analysis 2026 [1] |
| Severity tail | About 1 in 5 of those outages exceeded $1M | The tail, not the average, is what a bridge layer insures against. | Uptime Institute, Annual Outage Analysis 2026 [1] |
| Training-run fragility | 466 interruptions in a 54-day pre-training run; 78% hardware-related | Every unplanned break burns GPU hours mid-run, checkpoint or no checkpoint. | Meta Llama 3 pre-training report, arXiv:2407.21783 [2] |
| Grid access backlog | More than 2,060 GW queued in US interconnection queues (end of 2025) | New compute cannot assume timely grid headroom — buffer it inside the row. | Lawrence Berkeley National Laboratory, queue data [3] |
| Rack power swings | Power smoothing can cut peak grid draw by up to 30% (GB300-class, industry estimate) | Batteries already participate in rack power management, not just emergencies. | NVIDIA GB300 power blog; Futurum estimate [4] |
[1] Uptime Institute, Annual Outage Analysis 2026 — operator-reported cost bands for the most recent significant outage.
[2] Llama 3 pre-training run, arXiv:2407.21783 — 466 interruptions over 54 days on a 16,384-GPU cluster, 419 of them unexpected; 78% attributed to hardware failures.
[3] LBNL "Queued Up" interconnection queue data — combined generation and storage capacity active in US queues at end of 2025.
[4] NVIDIA engineering blog on GB300 NVL72 power smoothing; the 30% peak-reduction figure is a Futurum estimate, not an NVIDIA specification.
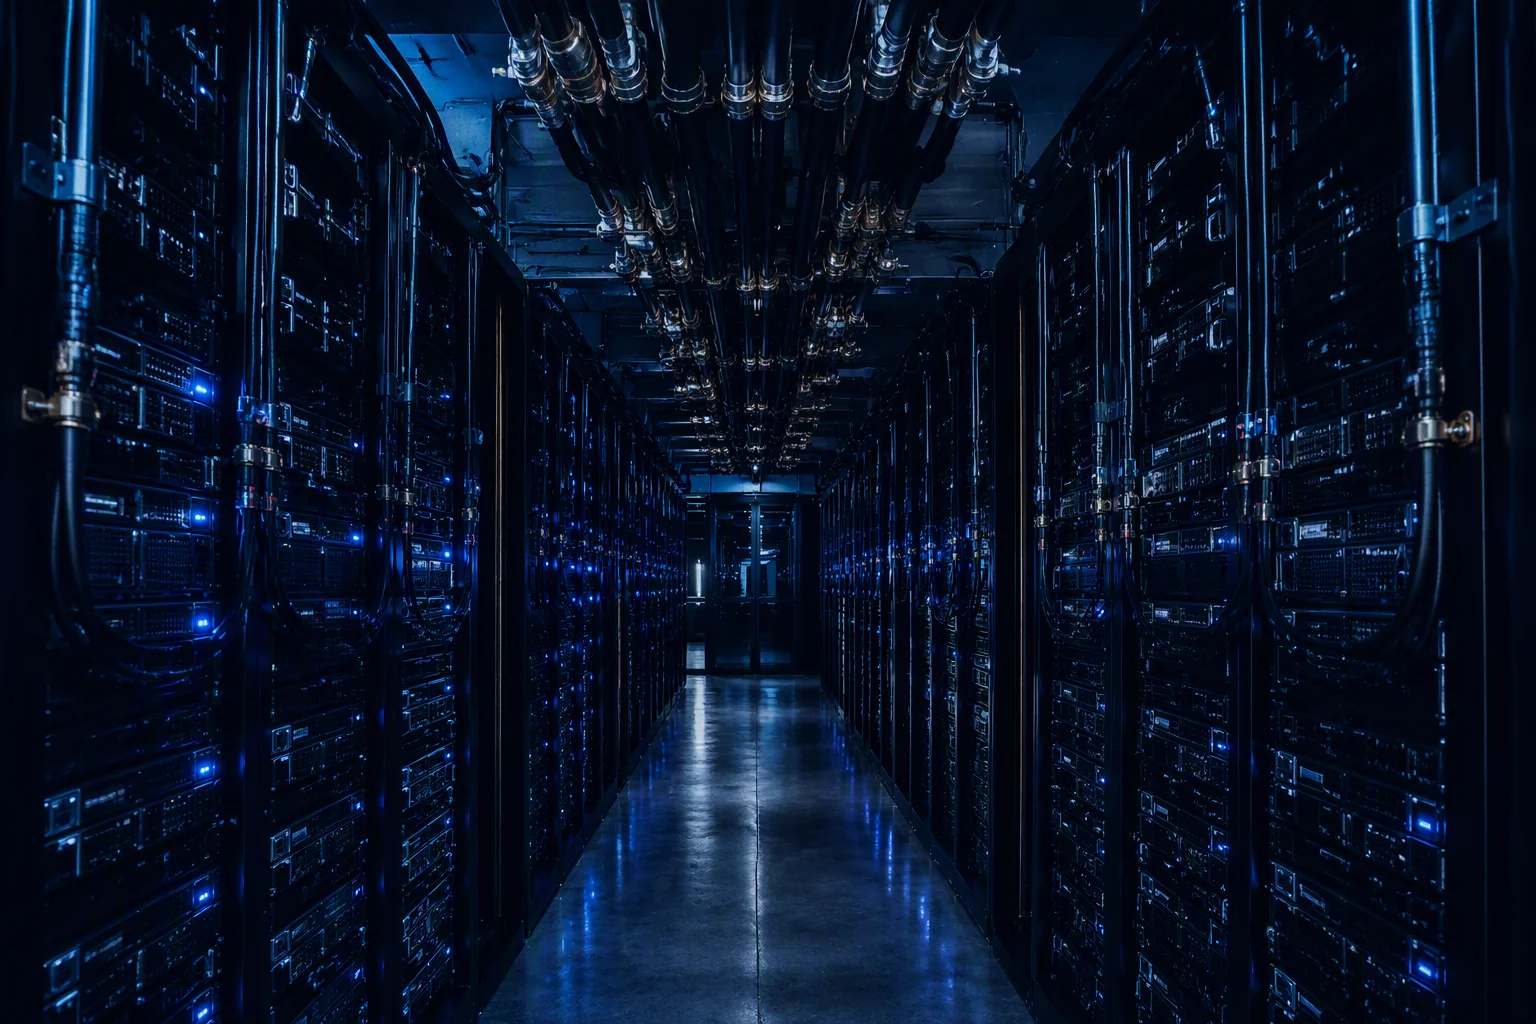
FIG 05 · 51.2V LFP BBU shelves in an AI rack row
The bridge layer
What a BBU buys between excursion and migration.
Grid excursions arrive as sags, dips and transfer gaps measured in AC cycles. A rack-level BBU sits on the DC bus between power shelves and IT load, carries the rack while upstream transfer or load shedding completes, and recharges quietly afterwards.
- Millisecond-class hand-off keeps GPU state alive through the gap.
- Distributed per rack — no single point of failure upstream of the shelf.
- Recharges from the same bus it defends, with no separate charging circuit to engineer.
- Planned migrations ride the bridge instead of the generator: cabinets stay up while feeders move.
- Serial-numbered shelves report CAN / RS485 telemetry into your DCIM layer.
Ratings per the VB-5125 platform datasheet; bridge figure measured at the shelf DC bus.
Powering an AI hall next quarter?
Start with the 51.2V LFP rack BBU shelf and keep the path to ±400V open. Send the rack architecture and target bridge time — engineering replies with a sizing proposal and sample plan.